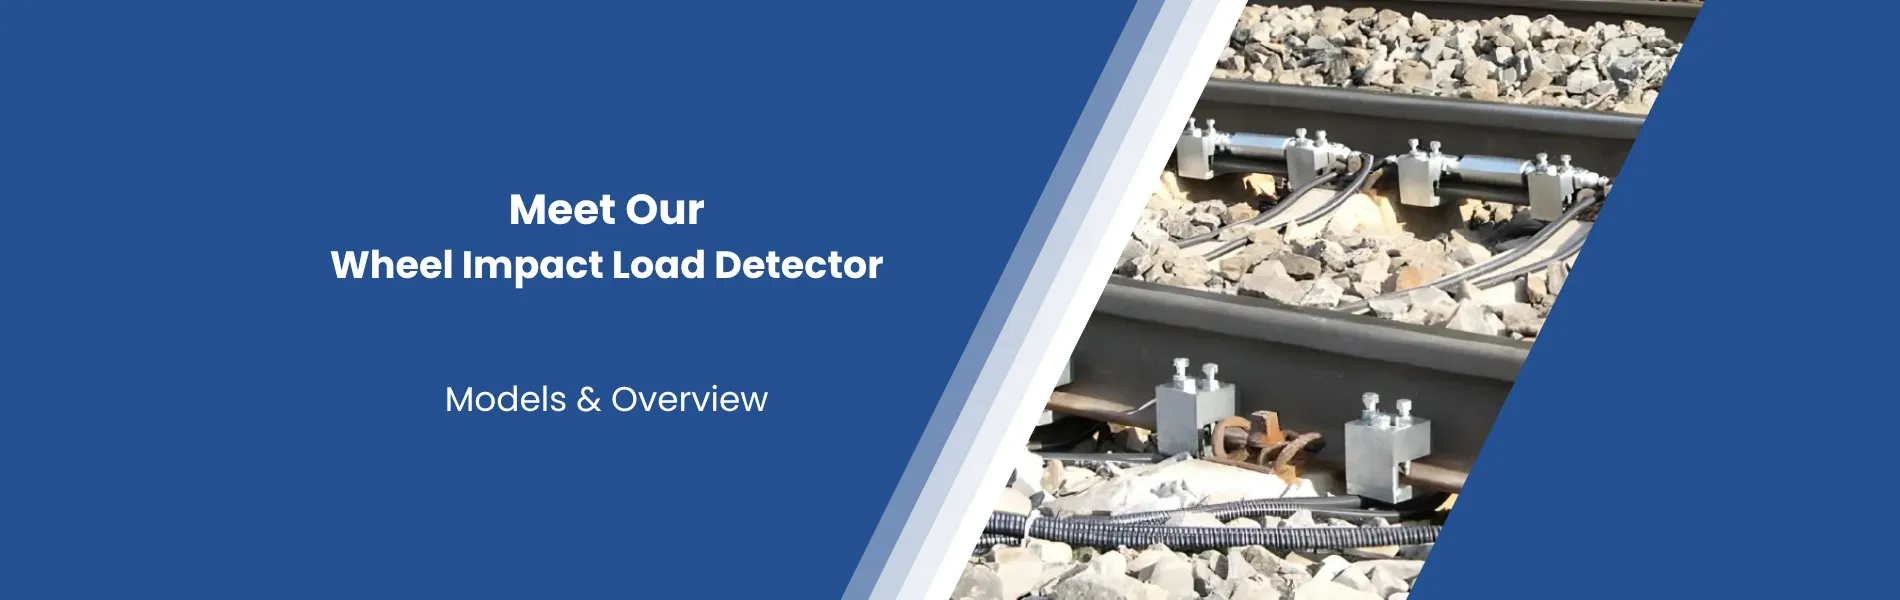
Monitor wheel force diagnosis automatic and reliable with ADOR Tech’s Wheel Impact Load Detector.
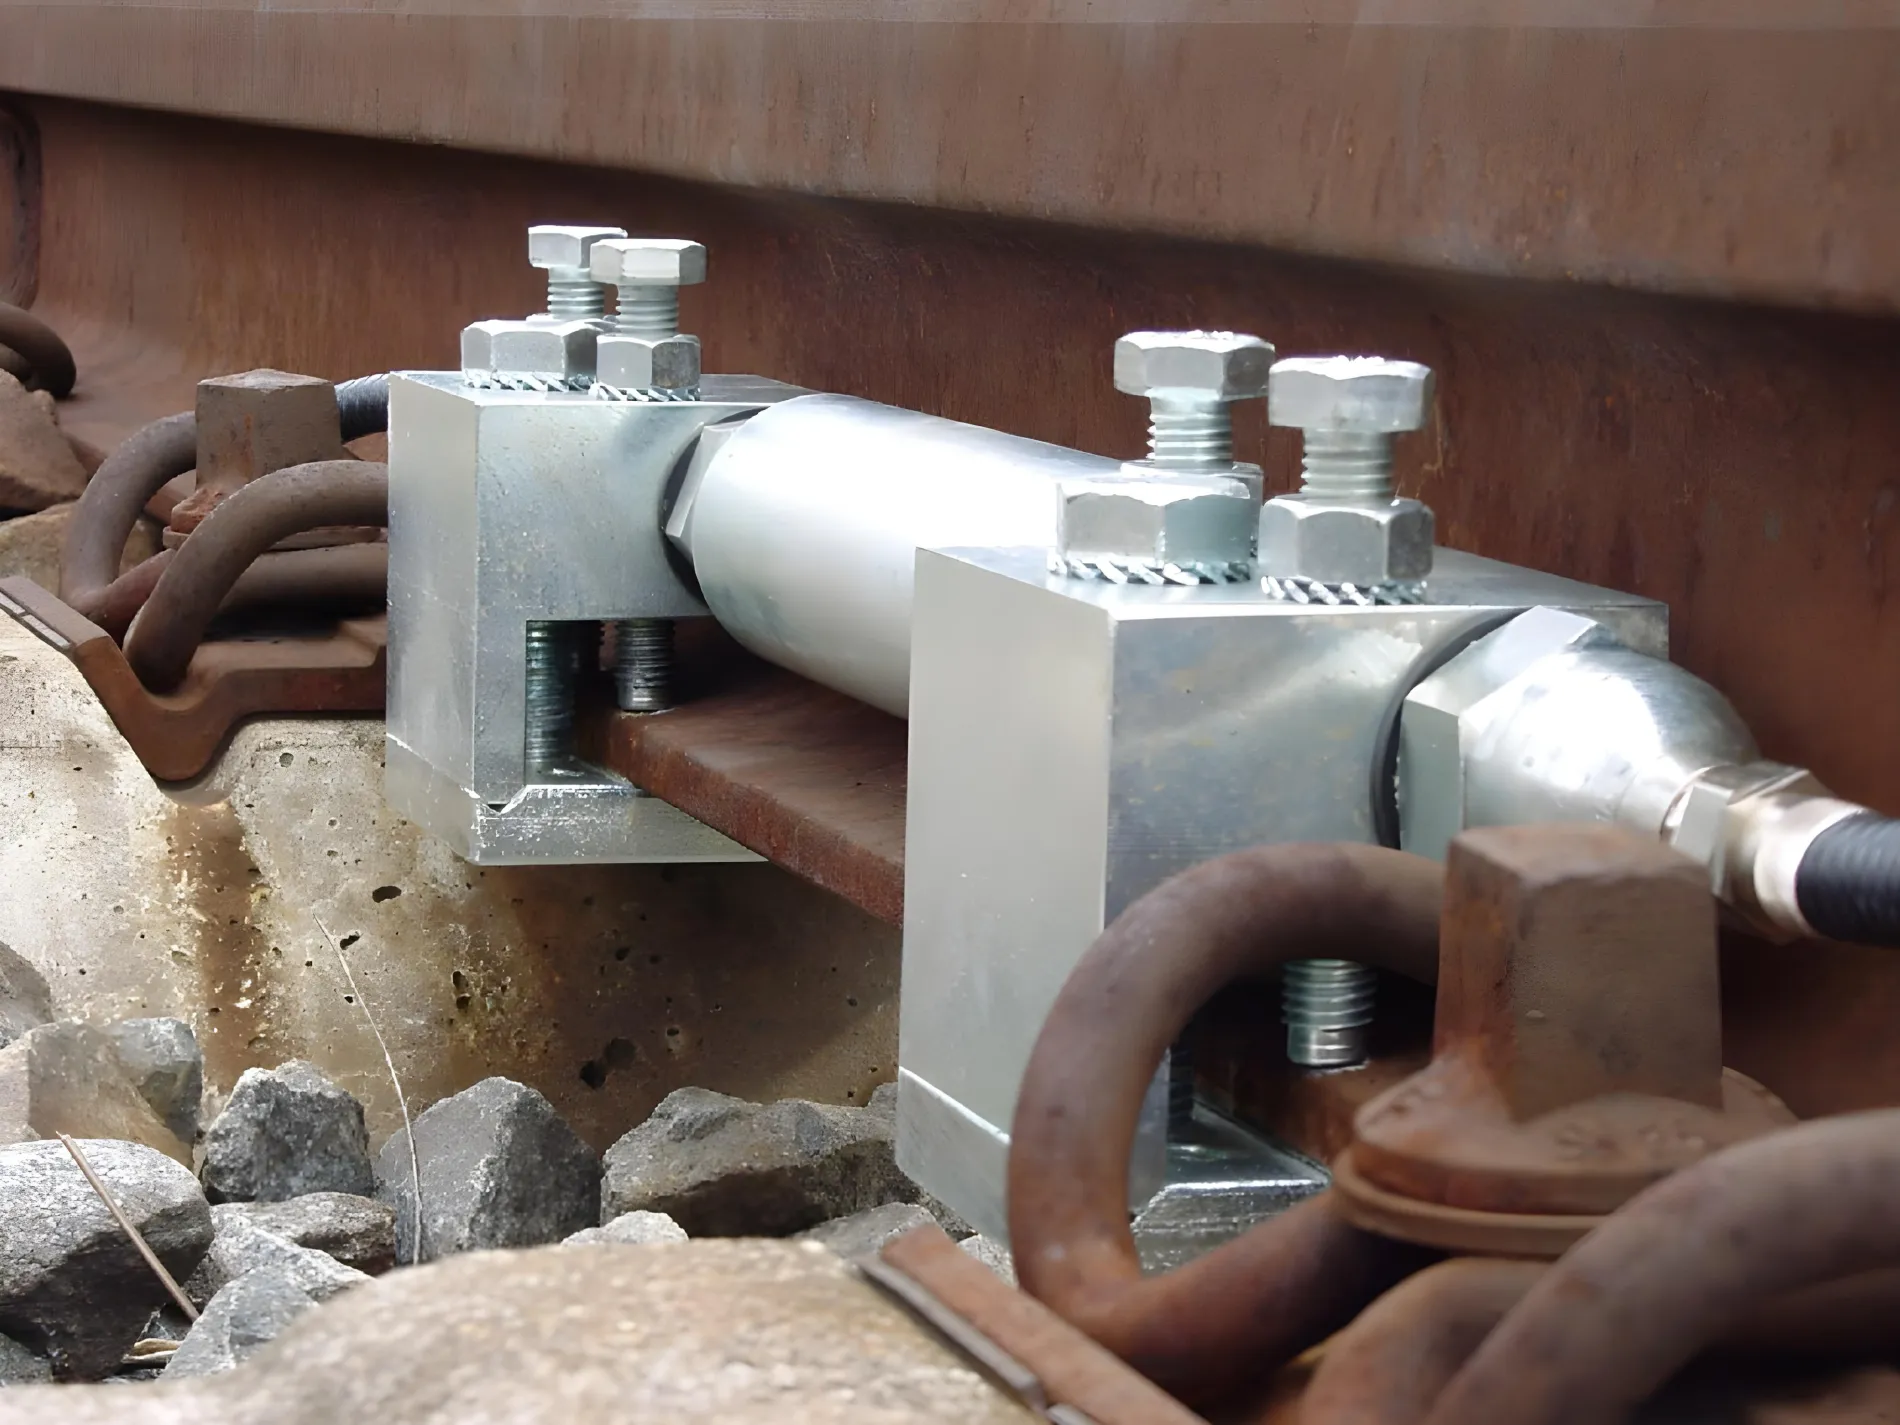
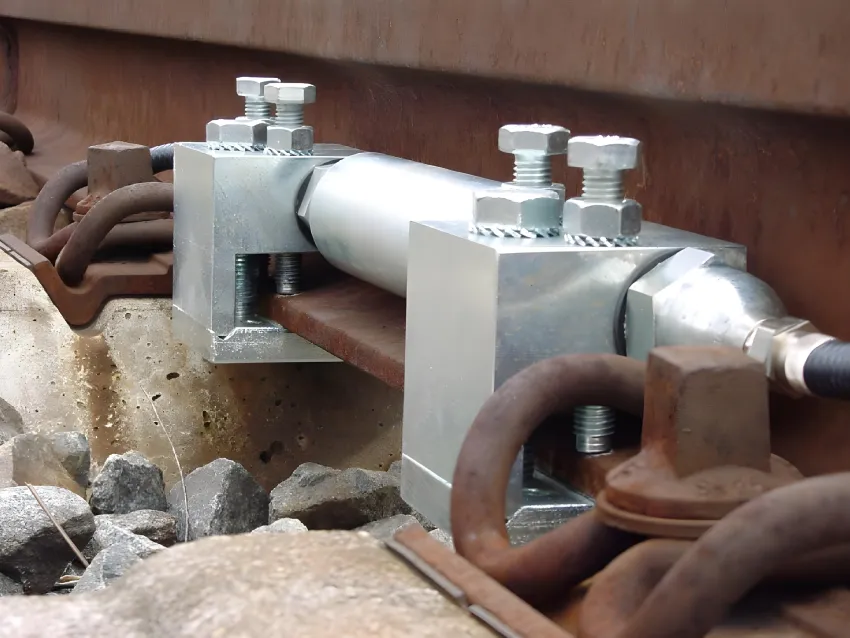
Wheel Impact Load Detector is a laser-based system used to measure wheel-rail interacted forces and assess wheel tread integrity under real operating conditions. Without any changes in railway infrastructure needed, the sensors of our wheel force monitoring system (LASCA) are installed on the tracks by positive locking clamping, offering a fully automated and reliable measurement.
Technical Specifications |
LASCA |
|---|---|
| Measuring Range | 10 kg-100 tons |
| Speed Range | 10-400 km/h |
| Wheel Diameters | 250-1273 mm |
| Datasheet |
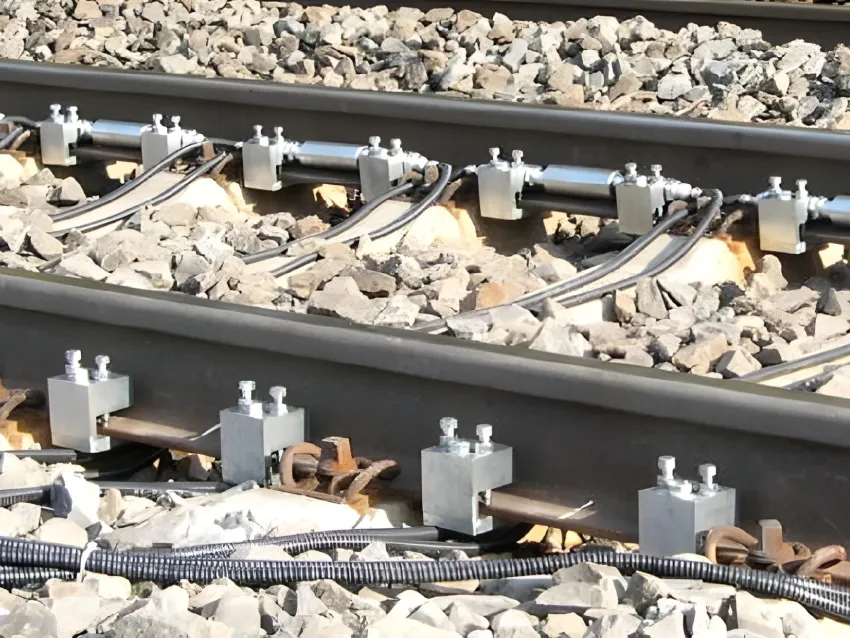
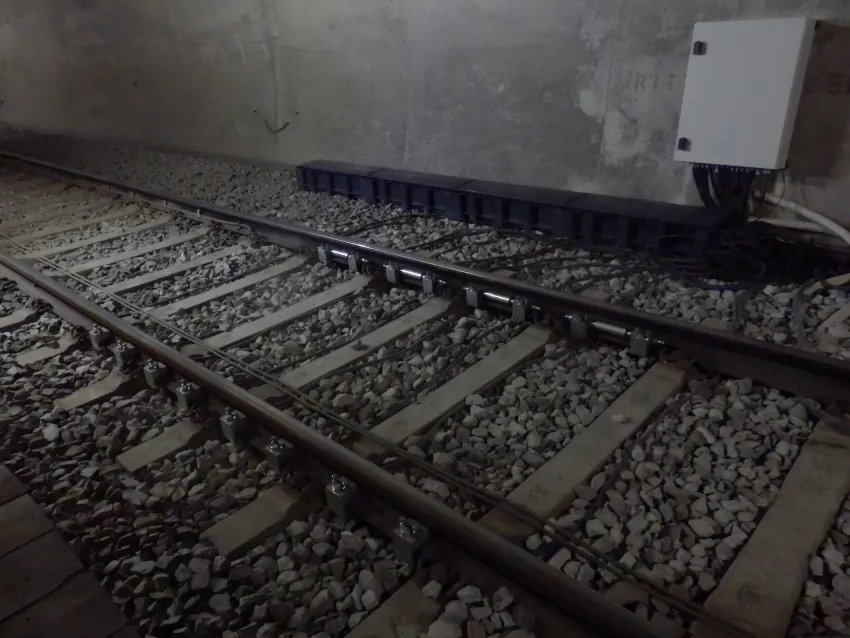
Position and install the wheel force measurement system on rail tracks. No changes are required in railway infrastructure.
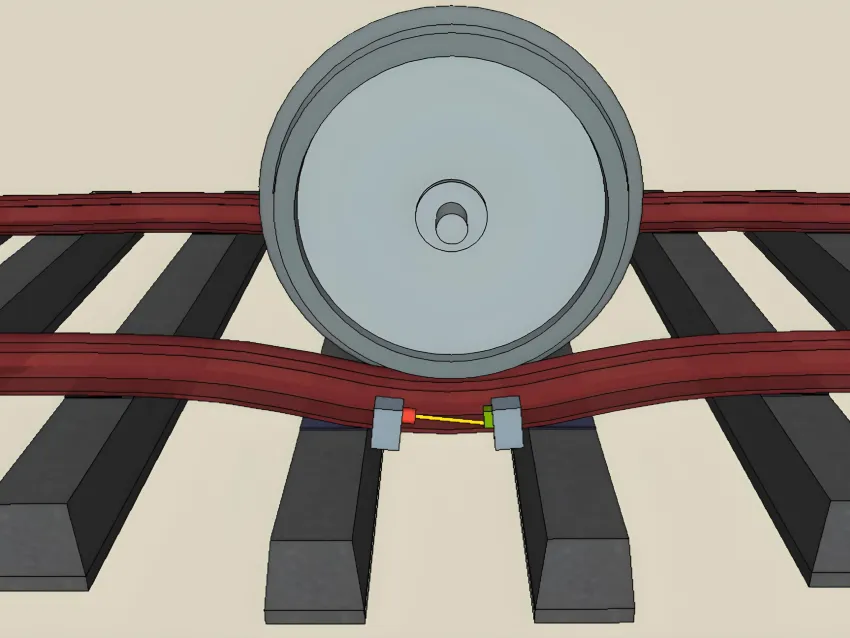
The system measures wheel-rail interaction while the vehicle moves through the section at operational speed.
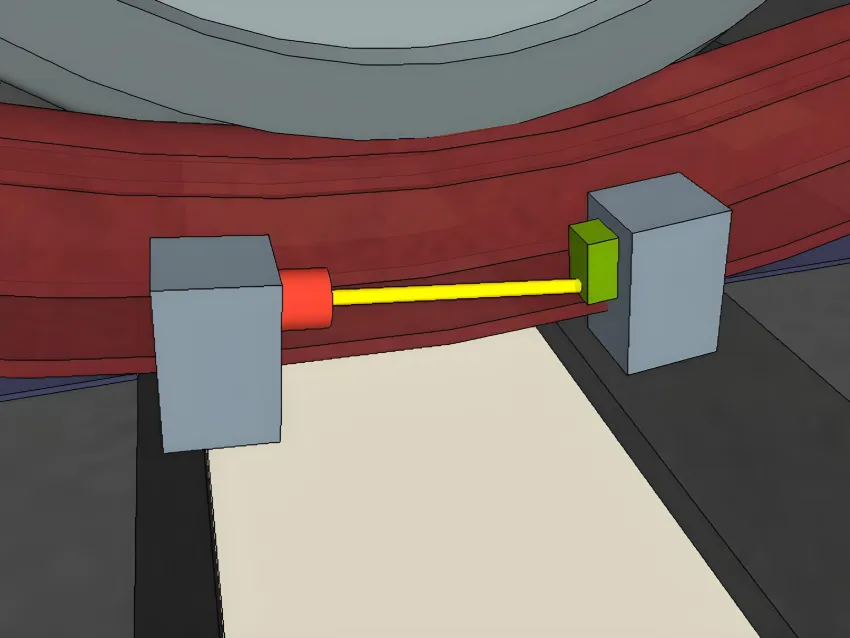
Optical laser sensors installed in sleeper compartments detect rail deformation and wheel forces.
The integrated software provides centralized data collection for fleet-wide analysis, providing real-time visualized reports to support predictive maintenance.
Wheel Impact Load Detector identifies train or vehicle automatically via transponder or database.
Wheel Force Monitoring System can efficiently detect wheel load, polygons, out of roundness, and wheel flat.
Yes. ADOR Tech’s wheel load measurement system provides centralized data collection and graphical reports and analysis to support predictive maintenance.
Yes. ADOR Tech’s trackside wheel monitoring system is equipped with laser sensors that can differentiate between periodic and stochastic irregularities.
Wheel Impact Load Detector is an advanced, rail-mounted technology that measures the forces a train’s wheels exert on the track while in motion. Unlike traditional inspection methods that require downtime or manual intervention, this system uses laser sensors and high-resolution electronics embedded in the track structure to detect wheel behavior dynamically under operational conditions. By analyzing the deflection of the rail caused by each passing wheel, wheel force monitoring system accurately determines the dynamic wheel load, force imbalance between axles, signs of irregular tread geometry, and indications of mechanical issues, such as tight bogies or suspension faults.
Wheel Impact Load Detector System is a key contributor to infrastructure wear and vehicle instability. With trains running at higher speeds and bearing heavier loads, the need for precise, real-time monitoring of wheel performance has never been more critical. Using the trackside wheel monitoring system provides a game-changing innovation that enables non-contact, continuous evaluation of wheel-rail dynamics.
wheel rail force monitoring system is a laser-based device installed and positioned on rail tracks. As a train passes over the sensors, the rail bends slightly under each wheel. The laser sensors measure the deformation at multiple points, creating a detailed force profile. The advanced software integrated into the wheel force monitoring system record and analyze wheel’s position, velocity, and force signature in real-time. Based on this data, the main parameters like wheel flats, wheel load, polygonal wear, and out of roundness are detected.
ADOR Tech’s wheel impact load detector, also known as laser-based wheel force diagnostic system (LASCA) is cutting-edge devices using laser technology to measure wheel-rail interactions automatically under real-time operational conditions. The data that this system collected from measurement and inspection can be exported in open formats, streamed to cloud platforms or centralized asset database, and used for real-time alerting, graphical visualization, or historical trend analysis to support predictive maintenance, ensuring operational integrity and safety.